Strategy for dynamic LCA calculations
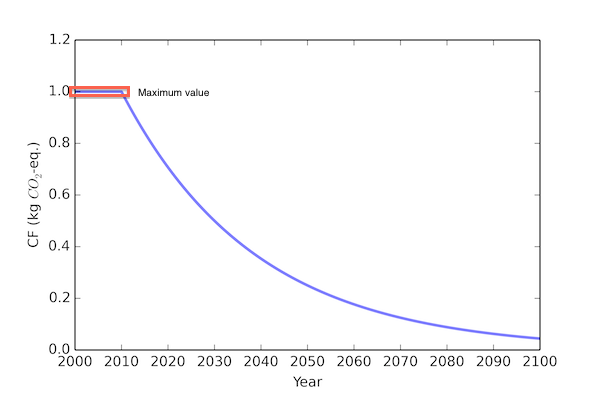
The first step before we do anything more complicated is to take our dynamic LCIA method, which has characterization factors which can vary with time, and create a “worst case” LCIA method where the maximum possible value of each characterization factor is used:
Next, we need to reduce some of the complexity of our product systems. Inventory databases can have thousands of different process datasets, with ten of thousands of connecting links. Most of these will not be important for our specific IA method and functional unit.
We use the graph traversal algorithm, which treats the technosphere matrix as a mathematical graph, as a screening step to get a list of process datasets which could be important. The worst case IA method is used for LCIA calculations, because if an input is not important (in the sense of contributing to the total LCA score) applying even the highest possible characterization factors, then we can safely exclude it. The result of this step is a list of inventory datasets (nodes) and exchanges (edges) that should be further investigated.
We then start from the functional unit, and traverse this reduced supply chain graph to determine the amount of each input, and when that input occurs. The biosphere flows for each process input are also calculated. We traverse through the supply chain until either the impact of a particular input falls below a cutoff criteria (by default, 0.1% of the total possible impact), or until the maximum number of traversal steps has been reached (by default, 10.000).
The result of this second traversal is a list of biosphere flows located in time. Specifically, for each element in the list we know:
- When it occurs
- What the biosphere flow is
- The amount of the biosphere flow
- What inventory dataset caused the biosphere flow
We can then construct different timelines, both of emissions of one biosphere flow, or of total emissions. We can also apply dynamic (or static) characterization factors to create a timeline of total environmental impact over time.